Business performance management works best when it is treated as a change discipline, not a reporting exercise. The point is to connect strategy, operating habits, and people decisions so leaders can see what is improving, what is drifting, and where the business needs to adapt. In U.S. organizations, that matters even more now because hybrid work, faster AI adoption, and higher expectations for fair, inclusive leadership have made weak management systems expensive.
The practical takeaway
- Use a small set of metrics that show both whether results are improving and why they are changing.
- Separate lagging results from leading signals so leaders can act before problems harden.
- Build a review rhythm that ends with decisions, owners, and deadlines, not just discussion.
- Make the system transparent enough that people trust it across teams, roles, and backgrounds.
- Expect change to fail when incentives, feedback, and behavior do not move together.
What this system really does in a strategy and change cycle
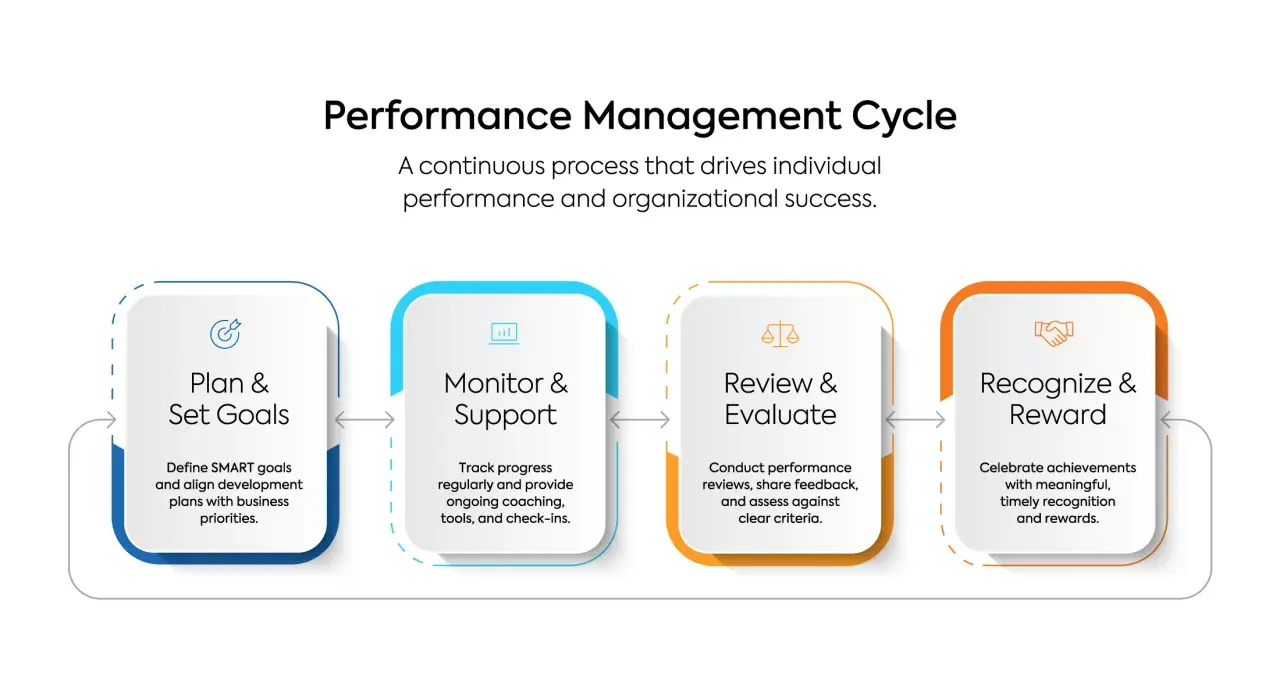
At its best, performance management is a feedback loop. Strategy says where the organization wants to win. Measurement shows whether the current way of working is producing that result. Change management turns the gap between the two into concrete action. If one of those pieces is missing, the system becomes decorative: lots of slides, little movement.
I usually reduce the whole idea to three questions. What outcome are we trying to move? Which behaviors or process changes will move it? What evidence will tell us that the plan is working or failing? That sounds simple, but it is where many teams lose the plot. They measure what is easy to count, not what actually drives the business forward.
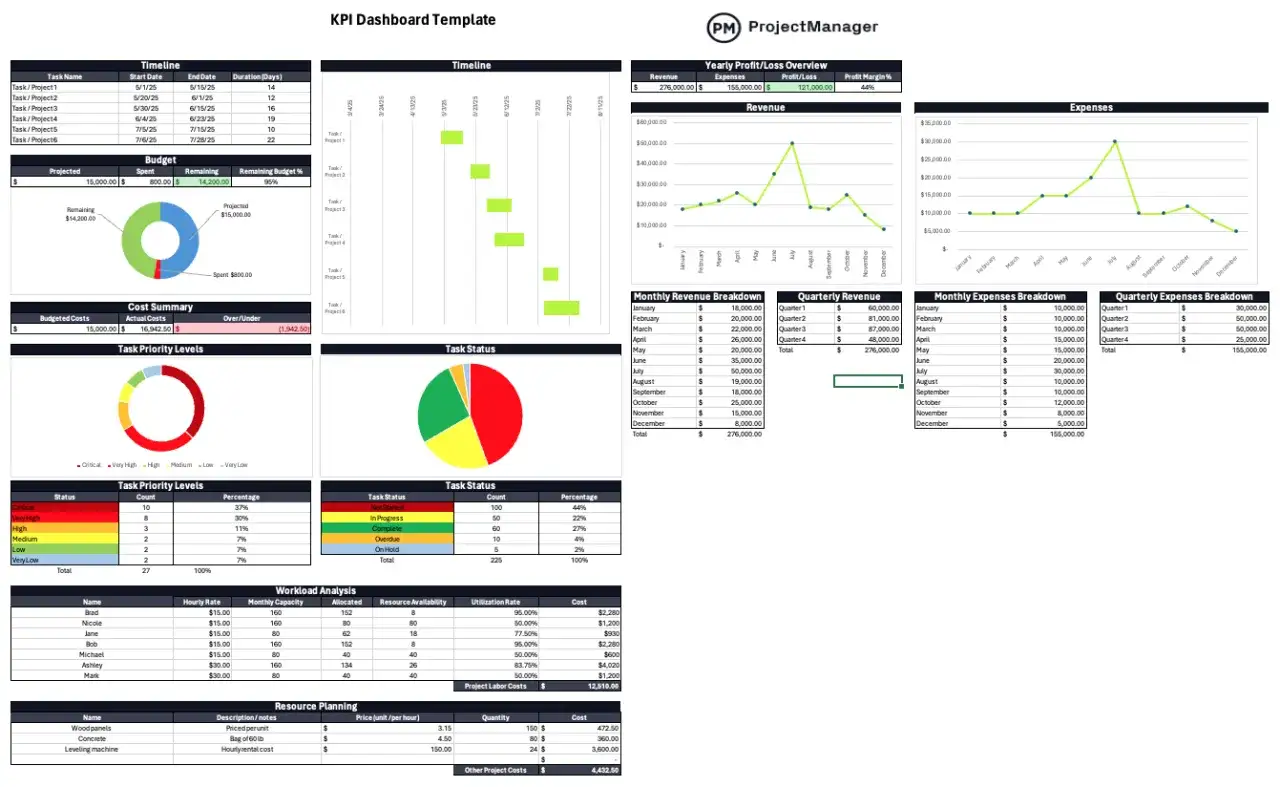
The real value is not the dashboard itself. It is the discipline of using the dashboard to decide what to stop, what to fix, and what to scale. Once you see it that way, the next step is choosing metrics that tell a useful story instead of a flattering one.
The metrics that matter and the ones that waste time
I prefer to group metrics into four buckets because that keeps the scorecard balanced and avoids the trap of over-focusing on revenue alone. A practical starting point is 8 to 12 core measures across financial, customer, process, and people/culture outcomes. More than that, and teams often start reporting for the sake of reporting.
| Metric bucket | What it tells you | Example measures | Common risk |
|---|---|---|---|
| Financial | Whether the business is creating economic value | Revenue growth, gross margin, cash conversion, operating expense ratio | Tracking results too late to influence them |
| Customer | Whether the market is responding well | Retention, renewal rate, complaint resolution time, net promoter trend | Confusing satisfaction with loyalty |
| Process | Whether the work is flowing efficiently | Cycle time, error rate, on-time delivery, backlog aging | Improving speed while quality silently slips |
| People and culture | Whether the organization can sustain performance | Manager 1:1 completion, internal mobility, promotion parity, engagement, regrettable turnover | Ignoring fairness, trust, and capability until they become costly |
I also separate lagging and leading indicators on purpose. Lagging indicators, such as revenue or turnover, tell you what already happened. Leading indicators, such as forecast accuracy, coaching frequency, or process completion times, tell you what is likely to happen next. If a metric cannot influence a decision within 30 to 60 days, I usually question whether it belongs on the main scorecard.
That distinction matters because strategy only becomes real when leaders can see the chain between daily behavior and quarterly outcomes. Once the right measures are in place, the cadence around them has to be equally disciplined.
Turn goals into a review cadence people can trust
Dashboards do not improve behavior on their own. Cadence does. The most effective teams I have seen use a simple rhythm that keeps attention on action instead of endless discussion.
- Weekly check the leading indicators, blockers, and urgent exceptions. Keep this short and operational.
- Monthly review results against target, compare trends across teams, and decide whether the plan needs a course correction.
- Quarterly revisit strategic assumptions, resource allocation, and whether the current metrics still match the business model.
- After every review assign one owner, one deadline, and one visible follow-up method so decisions do not evaporate.
If a review runs longer than 45 to 60 minutes, I usually suspect the agenda is too broad or the metric set is too large. The best meetings are not the most polished ones; they are the ones that end with clear decisions and a better understanding of what changed. That discipline becomes even more important when the organization is changing how people work together.
Why inclusive leadership makes the numbers more honest
Culture is not a side topic here. It affects whether people tell the truth about what is happening. If employees do not trust the process, they hide delays, soften bad news, or disengage from the entire system. That means the numbers may look stable while the organization is quietly losing energy.
Inclusive leadership improves performance management because it increases the odds that feedback is candid and that expectations are understood across different roles, identities, and working styles. Gallup's latest workplace reporting shows global engagement at 20% in 2025, with U.S. engagement at 32% at midyear 2025. Those numbers are a reminder that low trust and low connection can drag down even a very sophisticated operating model.
In practice, I would focus on four habits:
- Use clear criteria instead of manager memory when judging performance.
- Calibrate ratings across teams so one manager does not become an outlier for the wrong reasons.
- Review outcomes by role, location, and other legally appropriate dimensions to spot patterns early.
- Create safe channels for people to challenge bad data, unclear goals, or unfair treatment without retaliation.
The point is not to make the process softer. It is to make it truer. When people believe the system is fair, they are more willing to surface the information leaders need to change course. That is where many organizations stumble, especially during transformation.
Where performance systems usually break during change
The failure modes are surprisingly consistent. The technical setup may look modern, but the operating logic underneath it is often inconsistent. I see the same problems again and again:
- Too many KPIs, which makes the organization busy but not focused.
- No line of sight from team goals to company strategy, so local work feels disconnected.
- Incentives that still reward old behavior, which teaches people to talk differently but act the same way.
- Change programs that are launched like campaigns instead of embedded as routines.
- Managers who are expected to coach performance but were never trained to do it well.
The most damaging version is usually the quiet one: leaders announce a new direction, but the bonus plan, promotion criteria, and meeting habits all continue to support the old direction. People notice that mismatch immediately. If you want the system to change, the signals around it have to change too.
Once those failure points are visible, the practical question becomes how to roll the whole thing out without overwhelming the business.
A rollout model that fits how U.S. teams work in 2026
Deloitte's 2026 human capital research points in the same direction: organizations are moving away from one-off transformation programs and toward continuous adaptation. I think that is the right lens for this work. The best rollout is not a big-bang launch; it is a disciplined pilot that gets sharper over time.
| Phase | What to do | What good looks like |
|---|---|---|
| First 30 days | Define strategic outcomes, choose a small metric set, and assign owners | Everyone can explain what the business is trying to improve and why |
| Days 31 to 60 | Test the review cadence, check data quality, and calibrate managers | Meetings produce decisions, and the same metric means the same thing across teams |
| Days 61 to 90 | Connect the scorecard to incentives, coaching, and resource allocation | People start changing behavior because the system now reinforces the new priorities |
I would pilot this in one function or business unit first, especially if data lives in multiple systems or if the organization is highly distributed. In regulated or heavily unionized environments, document the definitions carefully before you automate anything. If the data model is shaky, automation only scales confusion.
After the first 90 days, the goal is not perfection. It is repeatability. From there, the final test is whether the system keeps improving without losing its human side.
The signals that tell me the system is actually working
When the approach is working, the organization starts to feel less reactive. Managers spend less time debating which number is real and more time solving problems. Employees understand what good looks like. Leaders can see where strategy is translating into action and where it is getting stuck.
- Fewer surprises in monthly reviews.
- Faster closure on blockers and escalations.
- More candid conversations between managers and teams.
- Better consistency in promotion, recognition, and workload decisions.
- Less noise around vanity metrics and more focus on outcomes.
The small habits matter here. Keep the scorecard lean. Revisit it every quarter. Retire metrics that stopped affecting decisions. And make sure the culture around the numbers is as healthy as the numbers themselves. When that happens, performance management stops being a compliance ritual and becomes a practical way to steer change with more clarity, fairness, and speed.